
How Accurate Are Referees? The PR v The Research
When your boss describes a statistic you’ve quoted about the accuracy of referees as “nonsense” then the only way to settle it is by rolling the sleeves up and doing some old-fashioned research. To start, let’s take a look at the particular numbers in question, from the article quoting the 98% accuracy figure for refereeing decisions:
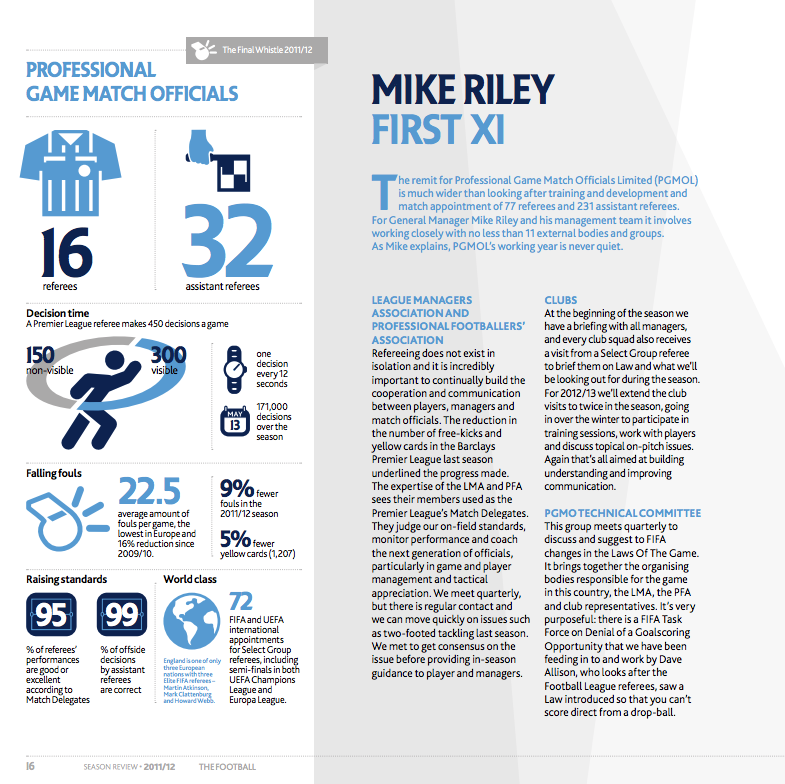
According to the PGMO (Professional Game Match Officials) Premier League referee makes around 245 decisions per game, three times more than an average player touches the ball over 90 minutes. That’s one decision every 22 seconds.
Approximately 45 of these decisions are technical – whether goal-kicks, corners or throw-ins – leaving around 200 decisions to judging physical contact and disciplinary actions.
Of those 200, around 35 are visible decisions where an action is taken (fouls, restarts), and 165 are non-visible, where play is allowed to continue.
In total, refs make around five errors per game, meaning they are right 98 per cent of the time.
The number of decisions referees have to make has increased by around three per cent in each of the last two seasons, and that is only likely to go up in the coming years as discussion around rule changes intensifies.
The assistant referee makes on average 50 decisions each game; 45 of these are pure offside judgements, with four of these resulting in offside flags. Their accuracy? Again, a staggering 98 per cent. (Sky Sports)
Background:
Many on this site will be aware of my ‘campaign’ on behalf of the officials in the Premier League this season. There are a few factors involved:
- My brother-in-law is a referee in the local leagues, and has been discussing his experiences learning the trade, and then the interactions he has with players, fans and those who rate him after the match.
- Constant focus on the officials takes away from the football, as highlighted by Chris Rowland in this article.
- Judging officials’ decisions, on a club-based website, is a recipe for bias. Whether we acknowledge it or not, we are open to looking at each decision in a vacuum of emotion. Each call by the referee or assistant ref is initially watched while we are all ‘involved’ in the game. Research suggests once a fan makes their mind up, even on one viewing, supplying evidence to the contrary is usually ignored or argued against.
- The job itself is incredibly difficult. And is getting harder and harder as the physicality and intensity of the league improves.
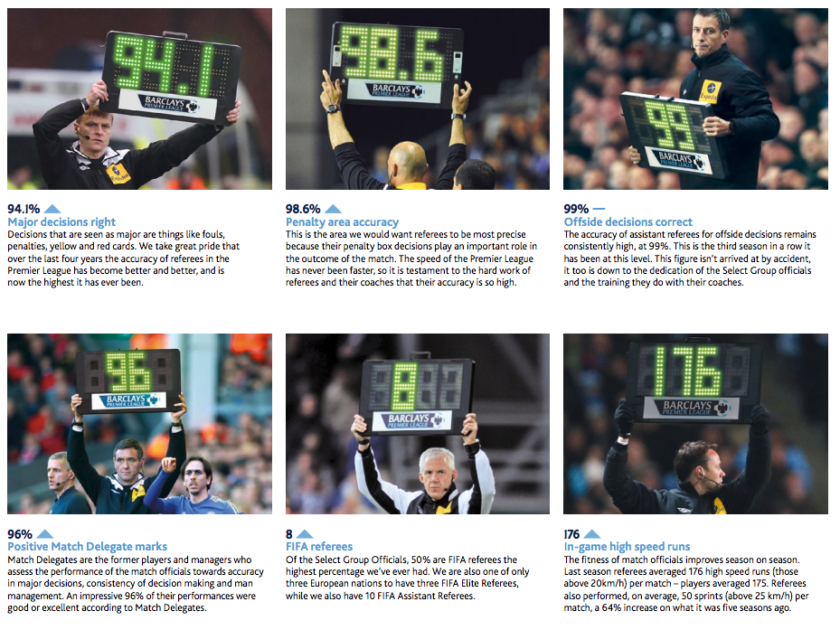
Prozone data shows top-division football is 20% faster than five years ago. Last season referees averaged 176 high speed runs (above 20km/h) whereas players averaged 175. They also performed, on average, 50 sprints (above 25km/h) in each game – which is a massive 64 per cent increase on what it was five years ago.
- The video below is a fine breakdown of the job – and even how ex-professional footballers at the top level struggle to find accuracy.
- This is further illustrated whenever the officials get ‘laymen’ to judge close calls, even when the physical aspect is taken away.
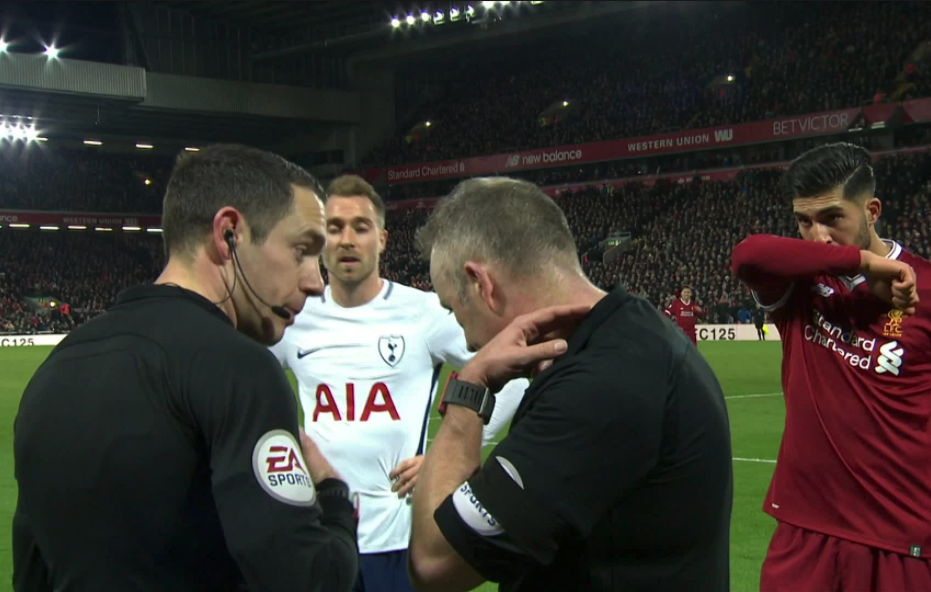
This past week Mike Riley, the head of the Professional Game Match Officials (PGMO), set a challenge for a roomful of football writers. He played a training-ground video showing three examples of a player passing the ball, a defender holding his line and an attacker running at full sprint. It was our job to decide if it was offside and, on each occasion, at least 80% decided the flag should be raised. When the replays were slowed down it showed they were onside every time. Twice it was by the sort of distance that might have seen a manager bursting a blood vessel if it had happened in the Premier League. (Guardian)
The Claim:
There’s a little bit of conflict over the exact figures, as they appear in three separate reports across a span of three years – and bear in mind this is the only place that I can find these figures, other than in online articles.
For full disclosure, I will include ALL the info on officiating in the reports.
Premier League Report – 2011/12
Premier League Report – 2012/13
(The image in the introduction)
Premier League Report – 2013/14
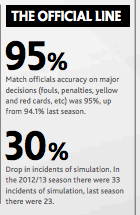
Interestingly, the amount of information seems to reduce over time in the reports, until that tiny snippet in 2013/14, before the whole thing disappeared from the reports themselves. I wonder why that could be?
More importantly, when looking at the apparent research done by the PGMOL there is zero method in the public arena. Are these figures based on all games? Have they been extrapolated based on the study of one match? If the figures do exist, why not publish them for all to see? Mainly so they can be verified by external judges. Finally, are you counting “non-visible” decisions just to increase the accuracy and massage the figures?
94% major decisions correct
- Fouls, penalties, yellow and red cards
98.6% penalty area decisions correct
99% offside decision correct
Without a published method, I’m going to have to speculate on the one they used using some actual video footage.
The rest of this article is for subscribers only and looks at all the academic research available in the public sphere to challenge these claims made by the PGMOL.

Source: tomkinstimes.com


Post a Comment